
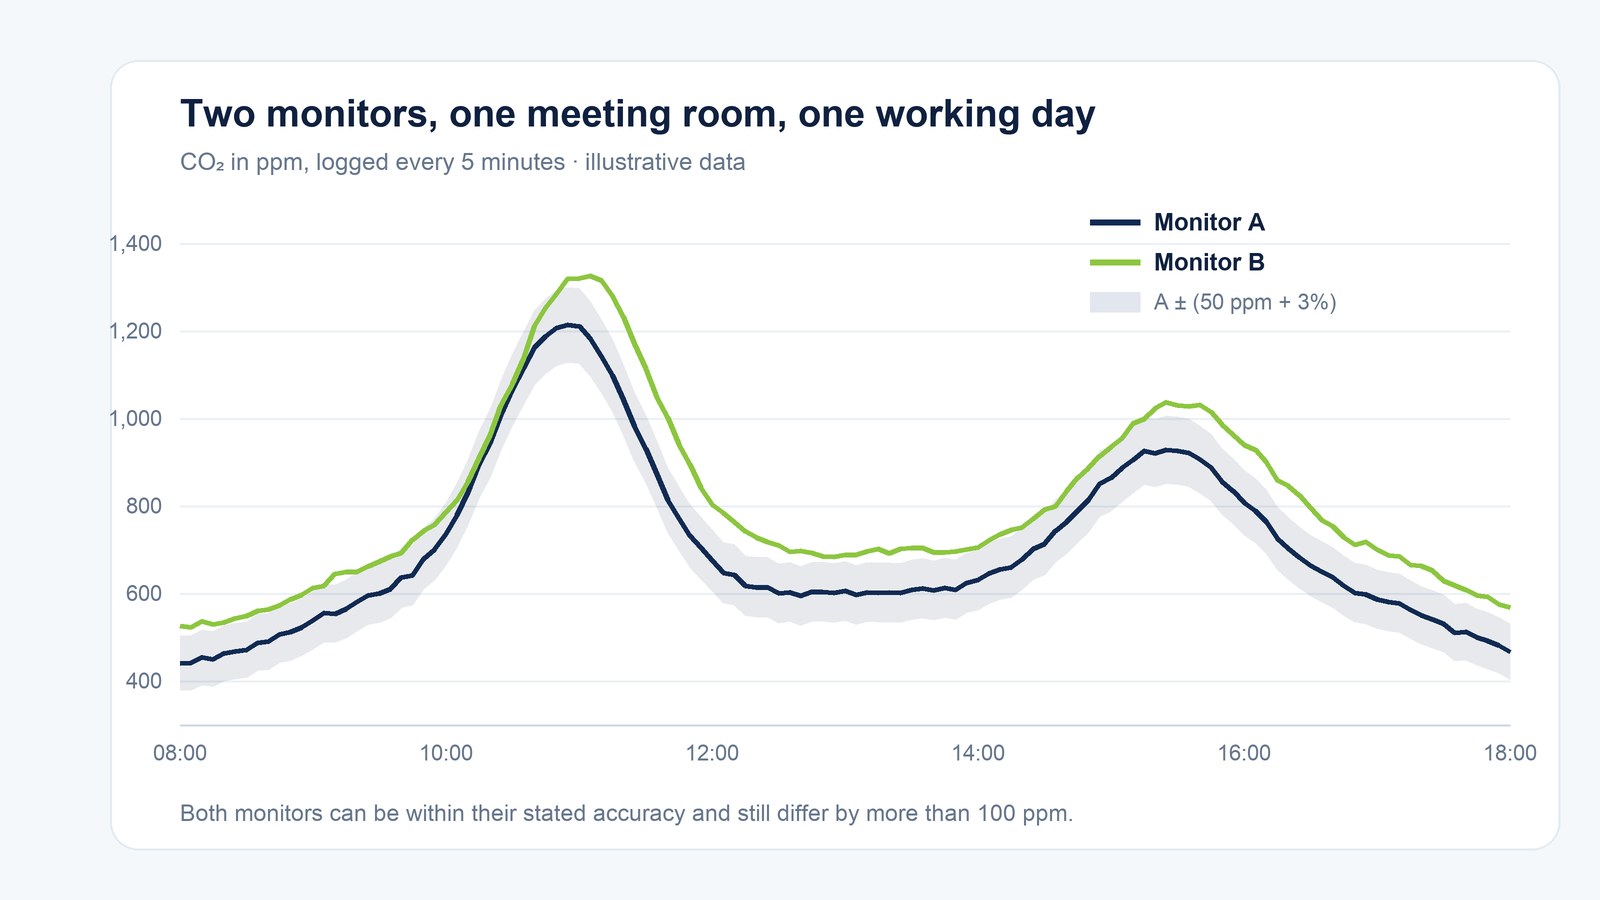
Two indoor air quality monitors in the same room usually disagree for one of five reasons: they are not reporting the same thing (unit, averaging period or timestamp); their stated accuracy allows them to differ even when both work correctly; their sensors react to humidity, dust or air pressure; their calibration differs or has drifted, including automatic CO₂ “self-calibration”; or they are sampling different air. Most disagreements can be explained with the datasheets, a side-by-side check and a record of where each monitor was installed. There are no widely accepted performance criteria for low-cost indoor monitors [3], so the buyer has to ask for that evidence.
Key takeaways
- Compare like with like before comparing values: parameter, unit, averaging period, time zone and timestamp convention.
- A datasheet accuracy of ±(50 ppm + 3%) lets two healthy CO₂ monitors differ by up to 160 ppm at 1,000 ppm.
- Optical particle sensors estimate mass from scattered light: high humidity can make them read high, and coarse desert dust is often under-read.
- Self-calibrating CO₂ sensors assume they regularly see 400 ppm outdoor air; the global background was about 426 ppm in 2025 [17], and some buildings never ventilate down to background.
- A VOC index and a TVOC concentration are different measurements, and neither equals a laboratory TVOC result.
- Ask for calibration evidence traceable to a reference, and run your own side-by-side check before monitors are dispersed.
1. Check that both monitors report the same thing
Before deciding that one monitor is wrong, confirm five things about both.
The parameter and the unit. Particles are reported in µg/m³ and CO₂ in ppm. Formaldehyde may be in ppb or µg/m³. “VOC” may be a dimensionless index, a concentration in ppb or a concentration in µg/m³ (section 5). Converting between ppb and µg/m³ depends on the molecular weight and on the temperature assumed.
The averaging period. A dashboard may show one-minute values, a 15-minute rolling mean or an hourly average, and limits are set over defined periods too: 8 hours, 24 hours or a daily average of occupied hours. Comparing a one-minute peak with an hourly average is the most common source of “disagreement”.
The timestamp convention. An hourly value may be labelled at the start or at the end of the hour. EPA’s sensor protocols ask testers to record which convention is used [1].
The time zone. Gulf Standard Time is UTC+4, and the UAE does not use daylight saving time. A device logging in UTC and a building system logging in local time will appear four hours apart. EPA’s guidance is to align instruments to a common standard clock and to check time zones before comparing data [1][2].
Data completeness. An average built from a few surviving values is not comparable with one built from a full set. EPA treats about 75% completeness as a useful criterion and counts an hour as valid when it has at least 45 one-minute values [2]. WELL’s continuous monitoring rules count missing data as an exceedance [29].
CO₂ in a meeting room rises from 600 ppm to 1,450 ppm during a 40-minute meeting, then falls after people leave. A monitor showing one-minute data reports the 1,450 ppm peak. A dashboard showing hourly averages reports a value near 1,050 ppm for that hour. A system that labels the hour by its end time shows the same average one hour later than a system that labels it by its start time. All three are correct; they answer different questions.
2. Accuracy, precision, bias and uncertainty: what the datasheet numbers mean
These four words are often used loosely. In measurement science they mean different things [4][5]:
- Accuracy is a qualitative idea: how close a measurement is to the true value. It is not a number.
- Precision is how closely repeated measurements, or identical units, agree with each other, usually expressed as a standard deviation or coefficient of variation.
- Bias is a consistent offset or slope away from the true value: the systematic error.
- Uncertainty is the range within which the true value is expected to lie, including both random and systematic effects.
A datasheet “accuracy” figure is normally given as ±(an absolute amount + a percentage of the reading), and it is valid only under the test conditions the manufacturer states. Check those conditions, the reference used, and whether the figure is typical or guaranteed.
CO₂. Two monitors each state ±(50 ppm + 3%). At a true 1,000 ppm, each may read anywhere from 920 to 1,080 ppm (50 + 30 = ±80 ppm). One may read 925 ppm and the other 1,075 ppm: both are within specification, yet they differ by 150 ppm.
PM2.5. Two monitors each state ±(5 µg/m³ + 5%). At a true 20 µg/m³, each may read 14 to 26 µg/m³. At low concentrations the fixed term dominates, so a 30% difference between two in-specification monitors is possible.
For a sense of what good field performance looks like, EPA published target values for PM2.5 sensors compared with reference monitors at 24-hour averages [1]:
| Metric | Target |
|---|---|
| Precision between identical units | SD ≤ 5 µg/m³ or CV ≤ 30% |
| Bias | Slope 1.0 ± 0.35; intercept between −5 and +5 µg/m³ |
| Linearity | R² ≥ 0.70 |
| Error | RMSE ≤ 7 µg/m³ or NRMSE ≤ 30% |
3. Particle sensors: why humidity and dust change the reading
How they work. Most monitors measure particles optically. A fan draws air past a laser, the sensor detects the light each particle scatters, and an algorithm converts counts and sizes into an estimated mass. That conversion assumes particle density, shape and refractive index, so the estimate depends on what the particles actually are [8][10]. The factory calibration is made against a reference aerosol and a reference instrument; one widely used sensor’s datasheet states that its PM2.5 output is calibrated against a laser photometer [13]. Calibrating against one optical instrument is not the same as calibrating against a filter-weighing method, so ask what the reference was.
Humidity. Many particles absorb water as relative humidity rises; they grow, scatter more light and are counted as more mass.
- In one field study a low-cost sensor’s readings rose sharply above about 75% RH [8].
- EPA notes that mist or fog can be detected as particles, and that RH above about 85% can cause overestimation [1][2].
- EPA’s US-wide correction for one popular sensor network includes an RH term; raw readings ran about 40% high before that correction [9].
- In air-conditioned GCC interiors RH is usually lower, but bathrooms, kitchens, pool halls, coastal villas with failing dehumidification and monitors near outdoor-air intakes can still see high humidity.
Dust. Desert dust is rich in coarse particles, and these are what low-cost optical sensors detect worst.
- EPA cautions that many sensors will not detect PM10 or dust well [2].
- In laboratory tests, none of six low-cost sensor models met its declared size range [10].
- During dust events in Utah, one common sensor under-read PM10 severely [11].
- Some sensors do not measure PM10 directly; they calculate it from the distribution of smaller particles [13]. During a GCC dust event such a sensor can show PM10 barely above PM2.5 while a different design shows a large rise.
The Qatar study, and its limits
Researchers at Texas A&M University at Qatar compared a research-grade optical photometer (TSI DustTrak DRX) with the filter-based gravimetric reference method, outdoors in Qatar’s desert environment. The photometer tracked changes closely but overestimated PM2.5 by a factor of about two and underestimated the coarse fraction by about 20%; a humidity-adjusted correction worked better than a constant factor [12]. The authors say their factors apply to aerosol with similar properties in similar environments.
The study does not generalise. It concerns one instrument type, used outdoors, at one location, so its correction factors should not be applied to indoor monitors, other sensor models or other cities. What it does show is that an optical reading in GCC dust can be wrong by a large factor, in either direction, until it is checked against a reference. As of October 2026 we found no peer-reviewed study comparing low-cost indoor PM sensors with reference instruments in a GCC country.
Indoors versus outdoors. A study of Dubai apartments found that fine particles entered homes far more readily than coarse ones: the indoor-to-outdoor ratio was about 0.77 at 0.3 µm and about 0.30 at 3–5 µm [35]. A monitor next to an entrance lobby will therefore see a very different dust event from one deep in the floor plate.
4. CO₂: pressure, self-calibration and outdoor baseline
How NDIR sensors work. Most CO₂ monitors use non-dispersive infrared (NDIR) sensors, which measure how much infrared light at about 4.26 µm the gas in a small cell absorbs. That depends on the number of CO₂ molecules in the cell, so air pressure matters: the error is roughly 0.1% per hPa away from the calibration pressure [16]. Some sensors let the installer enter the altitude or pressure [14].
Coastal GCC cities sit close to sea level, so this rarely matters there. At about 2,270 m, as in Abha in Saudi Arabia, standard-atmosphere pressure is about 770 hPa, and a sensor calibrated at 1,013 hPa with no pressure compensation would read roughly a quarter low. This is an inference from the ideal gas law [16]; check the monitor’s pressure setting.
Automatic self-calibration. Many CO₂ sensors correct their own baseline over time, assuming the room regularly returns to outdoor air. One sensor family assumes it sees about 400 ppm for at least a few minutes each week [14]; another takes the lowest reading over roughly eight days and treats it as 400 ppm [15]. This works in offices that are empty and ventilated at night. It fails in two common GCC situations:
- The outdoor baseline has moved. NOAA’s global annual mean was 425.62 ppm in 2025 (Mauna Loa: 427.35 ppm) [17]. A sensor that pins its baseline to 400 ppm will read about 25 ppm low when it does see outdoor air. Local outdoor air can differ from the global mean; this is our inference from the manufacturer documents and NOAA data.
- Some spaces never return to background. In hotel rooms, hospital wards, residences and 24-hour operations, the lowest weekly reading can be well above outdoor levels, and self-calibration then pulls the whole scale down. One sensor manufacturer advises disabling the function in such spaces and recalibrating every two to three years instead [15].
A guest room’s true night-time minimum is 650 ppm because it is occupied and receives little outdoor air. A self-calibrating sensor assumes that minimum is 400 ppm, so over the following weeks it reads about 250 ppm low across the whole range: a peak that is really 1,300 ppm is reported as about 1,050 ppm. A comparison with a recently calibrated reference instrument reveals the offset.
Spatial variation. CO₂ is not uniform in a room. A Lawrence Berkeley National Laboratory field study found differences of more than 200 ppm between sensor positions on different walls of the same room, and large errors across 208 building CO₂ sensors (a technical report, not peer-reviewed) [19]. ASHRAE’s 2025 position document states that indoor CO₂ is not an overall indicator of indoor air quality, notes that ASHRAE Standard 62.1 sets no indoor CO₂ limit, and says sensor performance, location and calibration are critical [18].
5. VOC index, TVOC and laboratory results are different measurements
VOC index. Many monitors use metal-oxide (MOx) gas sensors, which respond to a wide range of compounds but cannot tell them apart. One major manufacturer therefore reports a VOC Index on a scale of 1 to 500, where 100 is the average of the past 24 hours [20]. An index of 250 means “much more than this room’s recent normal”, not any particular concentration, and the manufacturer states that a concentration cannot be properly provided under field conditions [20].
Sensor TVOC. Other monitors convert the same kind of signal into a “TVOC” concentration by calibrating with a reference gas or mixture and applying a conversion factor. EPA cautions that such sensors do not measure all VOCs and that their output cannot be attributed to a specific compound or sum of compounds [2]. Hydrogen can strongly disturb MOx sensors [22], and in chamber tests consumer monitors’ TVOC readings agreed poorly with reference measurements [23].
Two monitors both register 200 ppb. One converts with a 22-compound reference mixture at 4.57 µg/m³ per ppb, as stated on one manufacturer’s datasheet [34], and reports 914 µg/m³. One expressed as ethanol-equivalent (about 1.88 µg/m³ per ppb at 25 °C) reports about 377 µg/m³. Same air, same signal, readings that differ by a factor of about 2.4.
Laboratory TVOC. Under ISO 16000-6 [24], air is sampled onto a sorbent tube, thermally desorbed and analysed by gas chromatography–mass spectrometry; TVOC is the total eluting between n-hexane and n-hexadecane, expressed as toluene equivalents. That is a different quantity from a sensor’s TVOC, so the two are not expected to match, and TVOC is a screening measure rather than a health-based value [21].
What this means for compliance. Several thresholds are written in µg/m³ TVOC: WELL [29], RESET [27], and in Dubai the Dubai Building Code [32] and Dubai Municipality guidance [31]. Find out which measurement the requirement means: in Dubai, pre-occupancy and Dubai Municipality compliance tests are carried out by accredited laboratories with calibrated equipment [31][32]. Formaldehyde is a separate case: laboratory methods (for example DNPH cartridges analysed by HPLC) and electrochemical sensors can disagree, and ppb-to-µg/m³ conversion depends on temperature (about 1.23 µg/m³ per ppb at 25 °C).
6. Calibration, adjustment and traceability
These three words are often run together. In metrology they are separate steps [5]:
- Calibration establishes the relationship between what a device shows and the value of a reference standard.
- Adjustment changes the device so that it reads closer to the reference. “Self-calibration” is really an automatic adjustment.
- Verification provides evidence that the device meets specified requirements.
Traceability means the result can be related to a reference through a documented, unbroken chain of calibrations, each with a stated uncertainty [5][6]. The calibration provider is responsible for supporting a traceability claim and the user for checking it [6]; NIST states that its test report numbers alone are not proof of traceability [7]. A calibration certificate is useful when it names the reference, the calibration points, the as-found and as-left values, and the uncertainty.
Drift. Sensors age. EPA notes that optical PM sensors often last between one and four years [2]. In a long field test, one of four units of a common optical sensor drifted progressively [25], and an analysis of a large sensor network found degradation increased with age and was highest in hot, humid climates [26]. Manufacturers’ lifetime figures are longer for some components (more than ten years for one optical PM and one NDIR sensor family [13][14]), but lifetime is not the same as staying within specification.
How often to recalibrate. There is no single agreed interval for indoor monitors; schemes and manufacturers set their own:
- WELL’s August 2025 Performance Verification Guidebook requires air-quality sensors to be recalibrated or replaced every three years; earlier 2025 editions said annually [29].
- RESET Air’s monitor standard requires an annual performance check [27].
- EPA suggests repeating side-by-side checks seasonally to annually [2].
- One CO₂ manufacturer suggests recalibrating every two to three years where self-calibration is disabled [15].
- In Dubai, the Building Code requires CO₂ sensors used for demand-controlled ventilation to be checked and recalibrated at intervals not exceeding 12 months, by specialised companies [32].
Follow the strictest requirement that applies to the building.
Six new monitors are placed together in one occupied room for seven days, logging every five minutes; EPA suggests about a week of data when comparing at five-minute resolution [2]. For each parameter, every unit is compared with the median of the group and, if available, a recently calibrated reference. Five units agree within each other’s stated accuracy; the sixth reads about 60 ppm CO₂ higher at every night-time minimum and is set aside before installation instead of being discovered a year later. In one classroom study, a correction derived from such a check reduced CO₂ error by 27% [37].
7. Placement: two good monitors in different air
Where a monitor sits changes what it measures. Each scheme sets its own placement rules, so use the one that applies.
| Source | Mounting height | Clearances and density |
|---|---|---|
| RESET Air v2.0, Commercial Interiors [27] | 0.9–1.8 m | At least 5 m from operable windows and supply diffusers; one monitor per occupied space type and per 500 m² |
| WELL Performance Verification Guidebook 2025-03 [29] | 1.1–1.7 m on a wall; ceiling only below 3.7 m, without displacement ventilation and with evidence of mixed air | Not in the direct airflow of vents, purifiers or fans; preferably 5 m from exterior doors; temperature and RH sensors 1 m from direct sun, supply outlets, fans and heaters; one per 325 m² (under 3,250 m²), per 500 m² (to 25,000 m²) or per 1,000 m² above that |
| LEED v5 BD+C, EQ credit 5, continuous monitoring option [30] | 1–2 m | Monitors “building grade or better” |
| US EPA guidance [2][3] | Breathing zone, about 1–1.8 m (3–6 ft) | Away from walls, sources, AC or heater vents and open windows |
Situations specific to GCC buildings:
- Sun on glazing can heat a monitor’s housing within minutes, distorting temperature and RH and, through them, particle and gas readings.
- Cold supply air from a diffuser drops temperature and raises relative humidity at the sensor.
- Entrance lobbies see dust events and traffic that the rest of the floor does not.
- Cooking and incense burning are strong local sources; a monitor next to them reports the source, not the room. Our guide to bakhoor and indoor air explains what each reading can and cannot tell you during incense use.
8. Keep the data comparable over time
- Synchronise clocks to a network time source, and record whether exports are in UTC or Gulf Standard Time.
- Keep the data behind any score. A single “air quality score” cannot be checked against a requirement.
- Report completeness. RESET’s 2018 monitor standard expects five-minute output with no more than 10% data loss [27]; WELL counts missing data as an exceedance [29]; EPA uses about 75% as a validity criterion [1][2].
- Log every change: firmware updates, which EPA notes can alter data processing [1], moves, sensor or module replacements and cleaning, so a step change in the data can be explained.
- Maintain the hardware. Optical sensors draw in dust; some run an automatic fan-cleaning cycle, weekly by default in one sensor’s datasheet [13]. Follow the manufacturer’s cleaning and replacement schedule.
9. What WELL, RESET, LEED and Dubai ask of monitors
- RESET Air v2.0 (2018) [27]: Grade A or Grade B accredited monitors; continuous PM2.5, TVOC and CO₂ plus temperature and RH; three consecutive compliant months for initial certification. RESET’s v2.1 is published as a draft and is not a requirement [28].
- WELL v2 (Q2 2025) with the Performance Verification Guidebook 2025-03 [29]: monitors that meet WELL’s accuracy table or are RESET-accredited at Grade B or above; data at intervals of 15 minutes or less; recalibration or replacement every three years.
- LEED v5 [30]: ratified in March 2025; its continuous monitoring option covers CO₂, PM2.5, TVOC, temperature and RH.
- Dubai. The Dubai Building Code requires a pre-occupancy test of formaldehyde, TVOC and PM10 with calibrated equipment, and demand-controlled ventilation in dense spaces with a CO₂ set-point below 800 ppm, an alarm above 1,000 ppm and CO₂ sensors recalibrated at least every 12 months [32]; Al Sa’fat applies this through clause 502.02. Dubai Municipality’s guideline GU119 (Version 4, December 2024) sets limit values and requires testing by an EIAC-accredited laboratory [31]. These are Dubai requirements; other emirates and GCC countries set their own rules.
We found no GCC regulation that sets an accuracy requirement for continuous indoor monitors. For health guidance, the WHO’s 2021 air quality guidelines, which WHO states apply indoors as well as outdoors, set PM2.5 at 5 µg/m³ as an annual mean and 15 µg/m³ over 24 hours [33]. For thresholds side by side, see our comparison of WELL, RESET, LEED and Al Sa’fat requirements.
10. Verification and procurement checklist
Use this list when specifying, comparing or accepting monitors. Each line is something a buyer can ask for, see or test.
A. Define the requirement before comparing products
- Purpose. Name each one that applies: operational monitoring, a certification scheme and its version, a complaint investigation, a lease or tenant reporting duty, or an authority requirement in the building’s jurisdiction.
- Jurisdiction. Name the emirate or country. Do not carry Dubai Municipality limits to Abu Dhabi, Sharjah, Saudi Arabia, Qatar or elsewhere; each has its own authority and rules.
- Parameters and units. Particles in µg/m³; CO₂ in ppm; formaldehyde in µg/m³ or ppb with the conversion temperature stated; VOC either as µg/m³ with its reference gas or as a dimensionless index. Never mix these.
- Averaging period for each parameter (for example 1 hour, 8 hours or 24 hours). Check that the monitor’s reporting interval and data export let you calculate it.
- Number and placement of monitors, taken from the scheme or a zoning plan, not from the quotation.
- Data. Completeness required, retention period, export format, data ownership, and whether a third party such as a certification body needs access.
B. Evidence to request for each model or SKU
- A current datasheet for the exact SKU and sensor set: sensing principle, range, resolution, accuracy as ±(absolute value + % of reading) with test conditions and reference, whether figures are typical or guaranteed, and operating temperature and humidity.
- Third-party performance evidence, dated and tied to the model and firmware: a monitor accreditation certificate with grade, parameters and expiry; an independent evaluation report (for indoor PM2.5 sensors, ASTM D8405 describes a chamber test method [36]); or a test against published performance targets. A product directory listing is not a performance test.
- A calibration certificate for each serial number: date, calibration points, as-found and as-left values, the reference and its traceability to a national metrology institute, the uncertainty, and the laboratory’s accreditation if claimed.
- The calibration and replacement policy: interval, method (factory recalibration, module swap or field co-location), turnaround, cost and loan units.
- CO₂ sensors: whether automatic baseline correction is used, the baseline it assumes and over what period, and whether it can be disabled in spaces that are never unoccupied.
- Particle sensors: sizing method, how mass is estimated, whether a humidity correction is applied, and performance on coarse dust (PM10) as well as PM2.5.
- VOC sensors: index or concentration; the reference gas if a concentration; and what the output can and cannot tell the user.
- Firmware: current version, how updates are delivered, and whether an update can change the data processing.
- Radio and electrical conformity for the country of installation. In the UAE, wireless devices need TDRA type approval; ask for the certificate rather than a statement.
C. Data, integration and IT
- Reporting interval and averaging: average, median or instantaneous sample; whether the timestamp marks the start or end of the interval; and whether times are in UTC or Gulf Standard Time (UTC+4).
- Time synchronisation method (for example NTP) and how the device behaves if it loses time.
- Local storage during network loss, its capacity, and whether buffered data back-fills automatically.
- Export formats, API documentation and BMS points lists (BACnet, Modbus, MQTT or REST, as offered), with each point’s unit, scaling and update rate.
- Network and security: power option (PoE class or mains), Wi-Fi bands and enterprise authentication, outbound ports, data location, and what happens to data and access when a subscription ends.
D. Installation and commissioning
- A placement plan: breathing-zone height as set by the scheme, and clearance from supply diffusers and returns, doors and windows, direct sun and heat sources, printers, and places where people stand and breathe on the device.
- An as-installed register: serial, SKU, firmware, room or zone, height, photograph, power, network and installation date for every device.
- Stabilisation: exclude the manufacturer’s stated warm-up period from the data.
- A side-by-side check of all units before they are dispersed, against each other and, where available, a reference instrument, with acceptance criteria agreed in advance and each unit’s offset recorded.
- End-to-end data verification: the dashboard, the export and the BMS show the same value, unit and timestamp.
- Alerts and thresholds configured from the requirement that applies to this building, and documented.
E. Operation and handover
- A monthly data-completeness report per parameter and device, with a gap log and the cause of each gap.
- Scheduled drift checks: co-location with a reference or recently calibrated unit and, for CO₂, a check that unoccupied-period readings make sense against outdoor air at the site.
- Maintenance records: cleaning, sensor or module replacement, and calibration due dates.
- A change log of moves, replacements and firmware updates, so a step change in the data can be explained.
- A handover pack: datasheets, calibration certificates, accreditation evidence, conformity certificates, points list, as-installed register, commissioning record, maintenance schedule and support contacts.
Red flags in a proposal
- An accuracy figure with no conditions, no reference and no statement of whether it is typical or guaranteed.
- “Calibrated” or “laboratory grade” with no certificate for the serial number.
- TVOC in µg/m³ with no reference gas, or a VOC index presented as a concentration.
- A single “air quality score” with no access to the parameter data behind it.
- “Real-time” readings with no stated sampling and averaging interval.
- Data held only in the vendor’s cloud, with no export or API.
- A certification or accreditation claim that does not name the scheme, the version, the model and the date.
Frequently asked questions
Why do two air quality monitors in the same room show different readings?
Usually for one of five reasons: different units, averaging periods or timestamps; accuracy tolerances that allow them to differ; sensor responses to humidity, dust or pressure; different or drifted calibration, including CO₂ self-calibration; and different positions in the room. Check the datasheets and run a side-by-side comparison before concluding that either one is faulty.
Which reading is correct?
Neither, by default. A reading is trustworthy when the monitor has recently been checked against a reference instrument whose calibration is traceable, under conditions like the building’s. Without that check, two readings tell you the range the true value probably lies in.
How often should an indoor air quality monitor be calibrated?
There is no single interval. Follow the building’s scheme and the manufacturer, whichever is stricter. WELL’s 2025 guidebook requires recalibration or replacement every three years, RESET’s monitor standard requires an annual performance check, EPA suggests side-by-side checks seasonally to annually, and in Dubai, CO₂ sensors that control demand-controlled ventilation must be recalibrated at least every 12 months.
Is a VOC index the same as TVOC?
No. A VOC index compares current air with that room’s own recent average on a 1–500 scale. A sensor TVOC converts a signal into µg/m³ using a reference gas. A laboratory TVOC under ISO 16000-6 sums the compounds in a defined range as toluene equivalents. The three are not interchangeable.
Do PM2.5 sensors work during dust storms and high humidity?
With caution. Optical sensors often under-read coarse dust and may calculate PM10 instead of measuring it, and they can read high when relative humidity is above roughly 75–85%. Treat readings during dust events and humid conditions with caution unless the monitor has been checked against a reference under similar conditions.
Does CO₂ self-calibration make a sensor accurate?
Only where the space regularly returns to outdoor air. Self-calibration often assumes outdoor air is 400 ppm, while the global background was about 426 ppm in 2025, and in spaces that are always occupied it can pull readings low by hundreds of ppm. Ask whether the function can be disabled and replaced by scheduled calibration.
About HawaQ
HawaQ is the indoor air quality business of PRO TECHnology in Dubai. We plan indoor air quality monitoring for buildings, run time-limited indoor air quality assessments, and support WELL, LEED and RESET projects. For a monitoring system’s specification, supply and quotation, see PRO TECHnology’s indoor air quality monitoring page.
Sources
- US EPA (2021). Duvall RM, Clements AL, Hagler G, et al. Performance Testing Protocols, Metrics, and Target Values for Fine Particulate Matter Air Sensors (outdoor, non-regulatory use). EPA/600/R-20/280. cfpub.epa.gov
- US EPA (2022). Clements A, Duvall R, Greene D, Dye T. The Enhanced Air Sensor Guidebook. EPA/600/R-22/213. cfpub.epa.gov
- US EPA. Low-Cost Air Pollution Monitors and Indoor Air Quality (page updated 13 October 2026). www.epa.gov
- Taylor BN, Kuyatt CE (1994). Guidelines for Evaluating and Expressing the Uncertainty of NIST Measurement Results. NIST Technical Note 1297. doi.org
- JCGM 200:2012. International Vocabulary of Metrology (VIM), 3rd edition. jcgm.bipm.org
- NIST. NIST Policy on Metrological Traceability. www.nist.gov
- NIST (2019). GMP 13: Good Measurement Practice for Ensuring Metrological Traceability. doi.org
- Jayaratne R, Liu X, Thai P, Dunbabin M, Morawska L (2018). The influence of humidity on the performance of a low-cost air particle mass sensor and the effect of atmospheric fog. Atmospheric Measurement Techniques 11:4883–4890. doi.org
- Barkjohn KK, Gantt B, Clements AL (2021). Development and application of a United States-wide correction for PM2.5 data collected with the PurpleAir sensor. Atmospheric Measurement Techniques 14:4617–4637. doi.org
- Kuula J, Mäkelä T, Aurela M, et al. (2020). Laboratory evaluation of particle-size selectivity of optical low-cost particulate matter sensors. Atmospheric Measurement Techniques 13:2413–2423. doi.org
- Kaur K, Kelly KE (2023). Performance evaluation of the Alphasense OPC-N3 and Plantower PMS5003 sensor in measuring dust events in the Salt Lake Valley, Utah. Atmospheric Measurement Techniques 16:2455–2470. doi.org
- Javed W, Guo B (2021). Performance evaluation of real-time DustTrak monitors for outdoor particulate mass measurements in a desert environment. Aerosol and Air Quality Research 21(6):200631. doi.org
- Sensirion (2023). Datasheet SPS30 particulate matter sensor, v2.0. sensirion.com
- Sensirion (2025). Datasheet SCD4x CO₂ sensor, v1.7. sensirion.com
- Senseair. The Senseair ABC algorithm. senseair.com
- Gas Sensing Solutions (2021). AN001: Pressure Compensating of a CO₂ Sensor, Rev 1.0. sstsensing.com
- NOAA Global Monitoring Laboratory. Annual mean CO₂, global and Mauna Loa. gml.noaa.gov
- ASHRAE (2025). Position Document on Indoor Carbon Dioxide (approved 12 February 2025). www.ashrae.org
- Fisk WJ, Sullivan DP, Faulkner D, Eliseeva E (2010). CO₂ Monitoring for Demand Controlled Ventilation in Commercial Buildings. Lawrence Berkeley National Laboratory, LBNL-3279E (technical report).
- Sensirion (2022). What is Sensirion’s VOC Index? Information note. sensirion.com
- Salthammer T (2022). TVOC – Revisited. Environment International 167:107440. doi.org
- Schultealbert C, Amann J, Baur T, Schütze A (2021). Measuring hydrogen in indoor air with a selective metal oxide semiconductor sensor. Atmosphere 12:366. doi.org
- Demanega I, Mujan I, Singer BC, et al. (2021). Performance assessment of low-cost environmental monitors and single sensors under variable indoor air quality and thermal conditions. Building and Environment 187:107415. doi.org
- ISO 16000-6:2021. Indoor air, Part 6: Determination of organic compounds (VVOC, VOC, SVOC) by active sampling on sorbent tubes, thermal desorption and gas chromatography.
- Sayahi T, Butterfield A, Kelly KE (2019). Long-term field evaluation of the Plantower PMS low-cost particulate matter sensors. Environmental Pollution 245:932–940. doi.org
- deSouza P, Barkjohn K, Clements A, et al. (2023). An analysis of degradation in low-cost particulate matter sensors. Environmental Science: Atmospheres 3:521–536. doi.org
- RESET. RESET Air Standard for Commercial Interiors v2.0 (2018) and RESET Monitor Standard v2.0 (2018). www.reset.build
- RESET. RESET Air v2.1 (draft). www.reset.build
- IWBI. WELL v2, Q2 2025, features A01 and A08, and WELL Performance Verification Guidebook, version 2025-03 (13 August 2025). a.storyblok.com
- USGBC. LEED v5 Building Design and Construction rating system (November 2025), EQ credit 5. LEED v5 ratified 28 March 2025. support.usgbc.org
- Dubai Municipality. Technical Guidelines for Indoor Air Quality for Healthy Life, DM-HSD-GU119-IAQ, Version 4 (11 December 2024). dmpmedia.dm.gov.ae
- Dubai Municipality. Dubai Building Code, 2021 edition, sections H.4.8.3 (demand-controlled ventilation) and H.4.10.3 (indoor air quality), binding under Decree No. 45 of 2021.
- World Health Organization (2021). WHO Global Air Quality Guidelines. www.who.int
- Kaiterra. Sensedge technical specifications (TVOC conversion using a 22-VOC Mølhave mixture). www.kaiterra.com
- Jung C, Abdelaziz Mahmoud NS (2023). Navigating dust storms and urban living: an analysis of particulate matter infiltration in Dubai’s residences. Frontiers in Built Environment 9:1297520. doi.org
- ASTM D8405-21. Standard Test Method for Evaluating PM2.5 Sensors or Sensor Systems Used in Indoor Air Applications.
- Honan D, Garvey J, Littlewood J, et al. (2026). Low-cost CO₂ sensors: on-site performance evaluation and co-location correction procedure. Sensors 26:1265. doi.org
The worked examples are illustrative calculations, not measurements from a HawaQ project. Sources were checked on 17 October 2026. This guide explains measurement practice and public standards in plain language; it is not legal advice, so check the current version of each document for compliance decisions.